Lesson 19: Wrapping up and looking ahead
Today is our last class!
Thank you for joining us this semester. It has been great to have you all in the course.
Course evaluations
Please complete the course evaluations when they become available at the end of the semester
Unfortunately, we will not be able to get our course evaluations until the end of the semester. Students formally enrolled (both for credit or audit) should get an email with a link to the evaluation at that time, and I would really appreciate it if you can take a few minutes to answer the questions.
This course is continuously under active development, so I would really value everybody’s feedback on how we can improve it and make it as useful as possible.
Please share your candid thoughts and suggestions in the evaluation. Remember that all comments are completely anonymous and I only get to see it after S/U decisions have been submitted.
If anyone has feedback or suggestions they would like to share right
away, we would be happy to hear your thoughts! You can either private
message, email, or post in the feedback channel on
Slack.
Agenda for today’s class
- Continued access to the course material
- Important take-home messages and a review of good practices
- Where to learn more and connect with the R user community
- Other applications
Continued access to the course material
- The course website will stay up, but will get updated next time we teach the course (probably Fall 2026)
- Fork or clone a copy of our course repo if you want a permanent copy of the course notes
- Zoom recordings stay on Canvas for 120 days
Good practices
1. Keep your raw data raw
Resist the temptation to manually edit or reformat your original file because if your documentation of the changes is imperfect, you may lose important information. Clean up the data in R. Your R code, along with appropriate documentation will be a record of the changes. The code can be modified and rerun, using the raw data file as input, if needed.
2. Make sure all your processing steps are included in your scripts and test that your code can run in a new environment
Make sure that your code does not rely on objects or functions defined outside of your script. If that is the case, it can’t readily be run by yourself or someone else in the future.
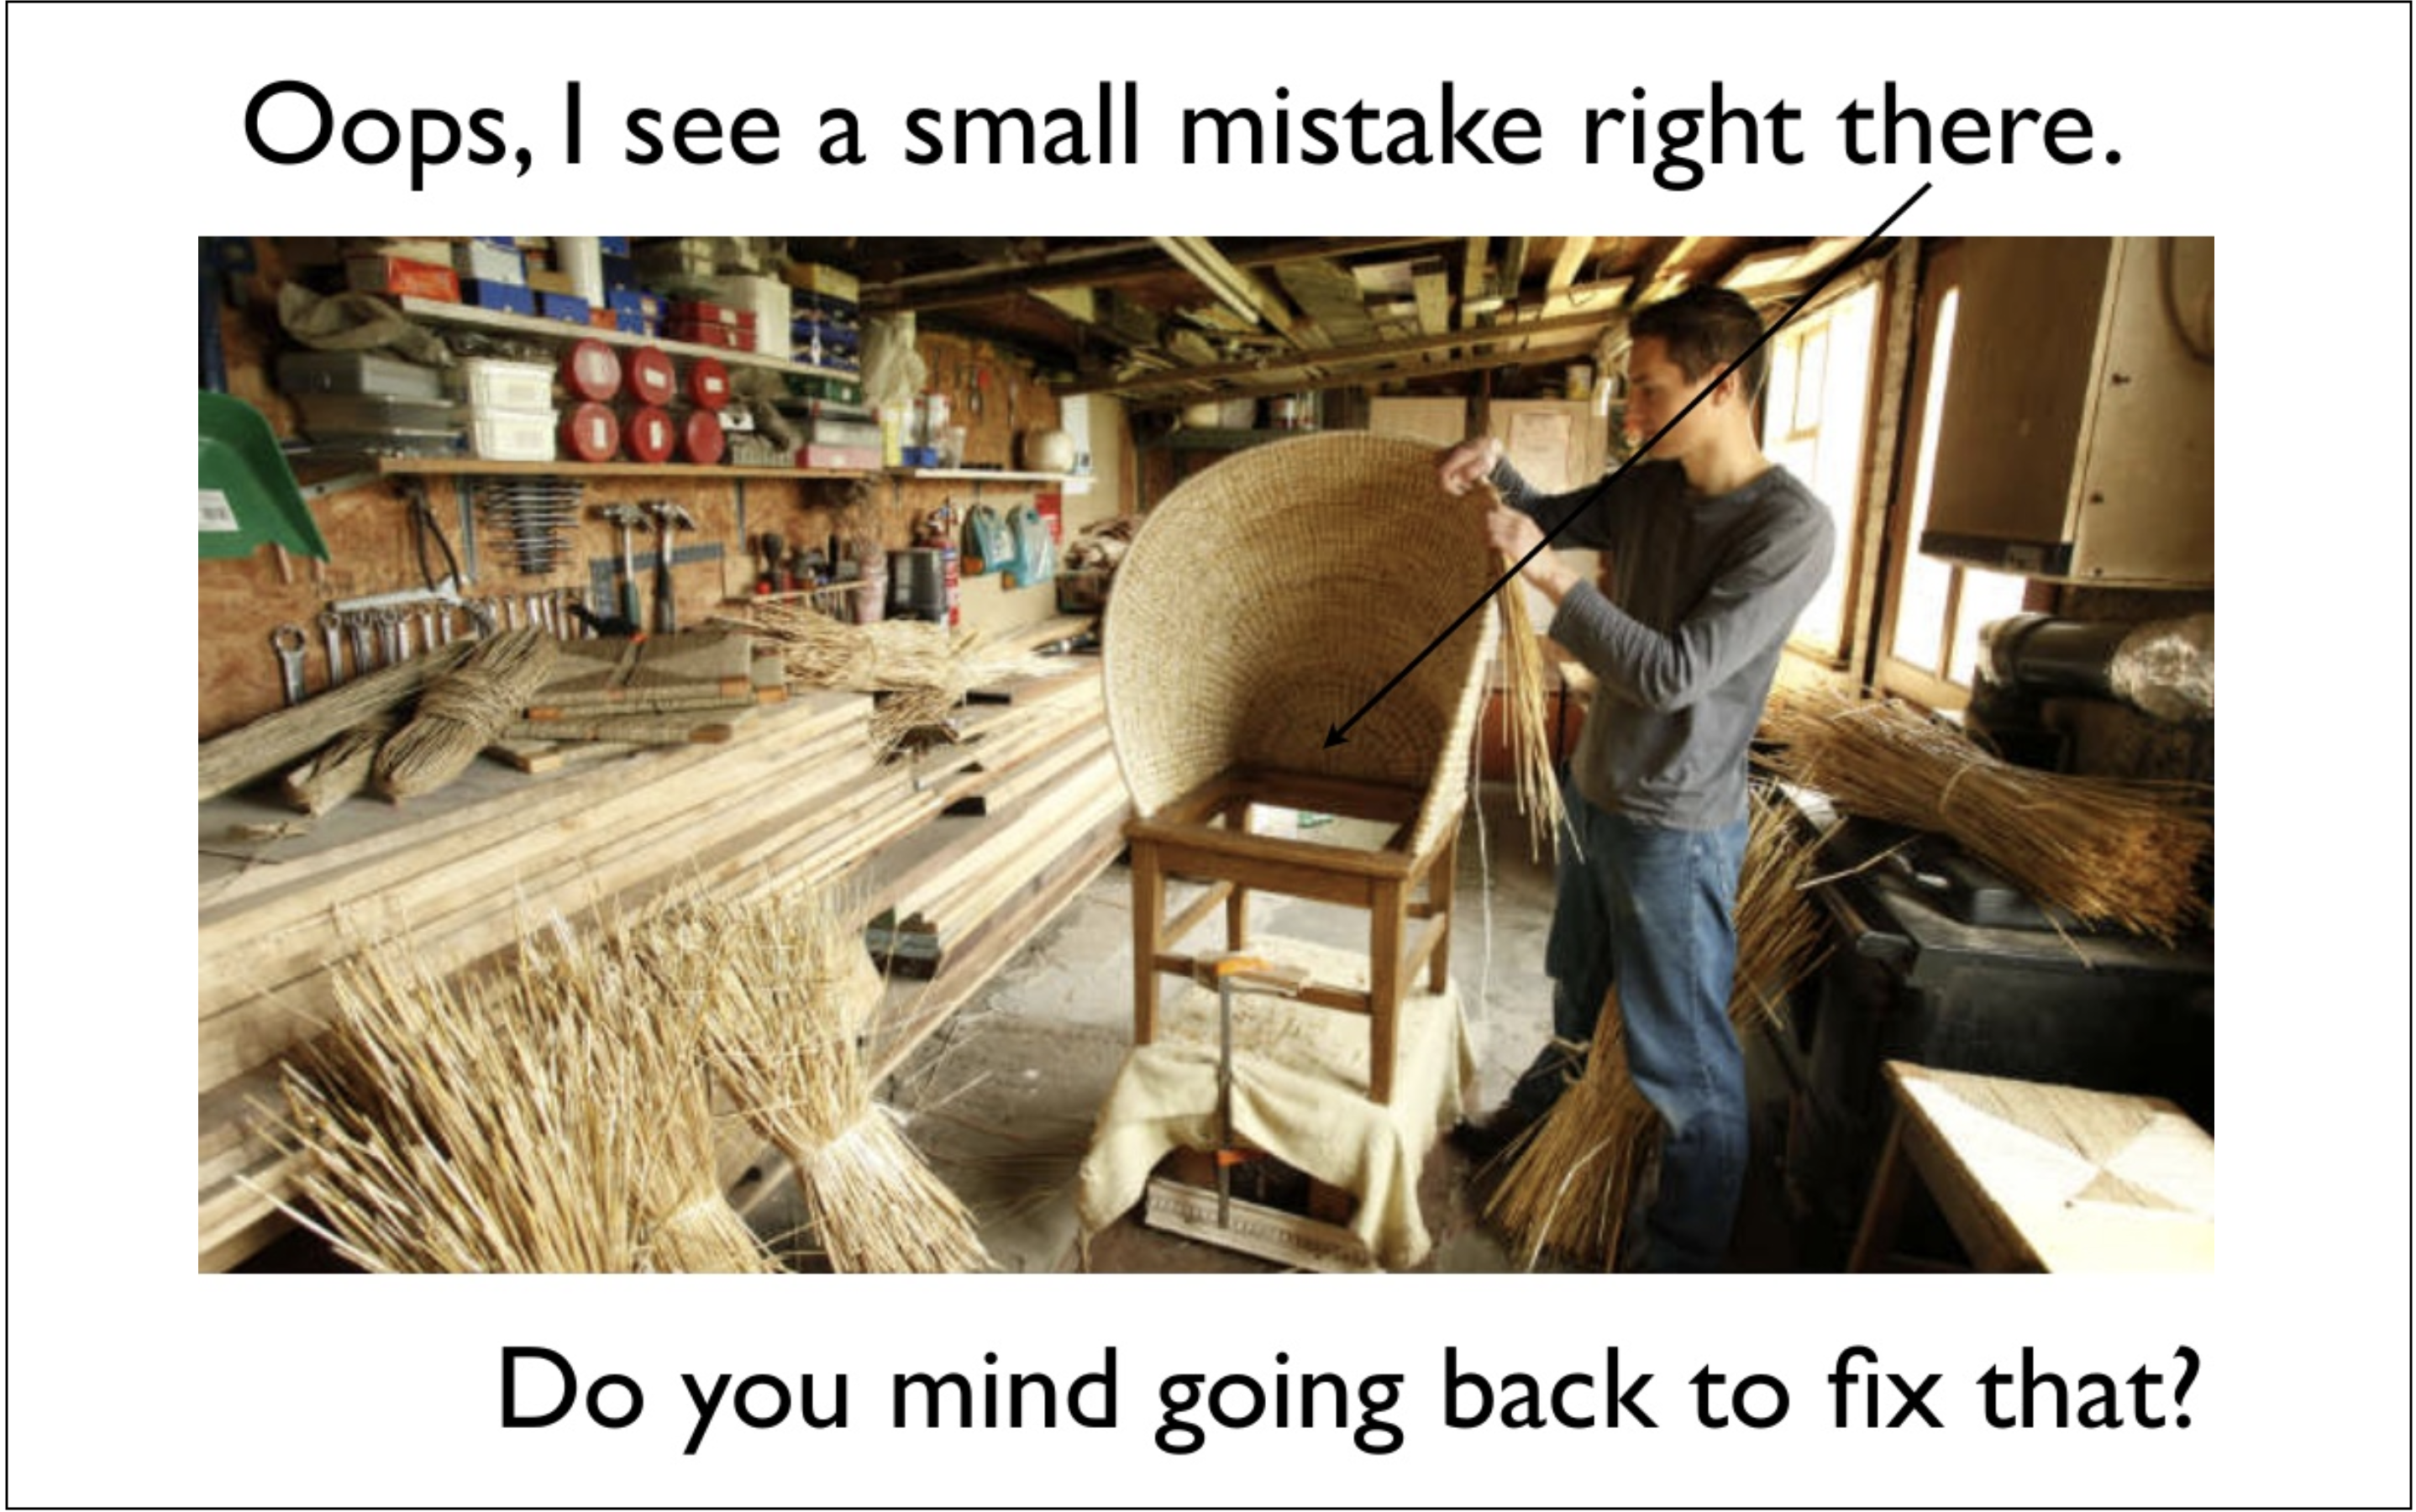
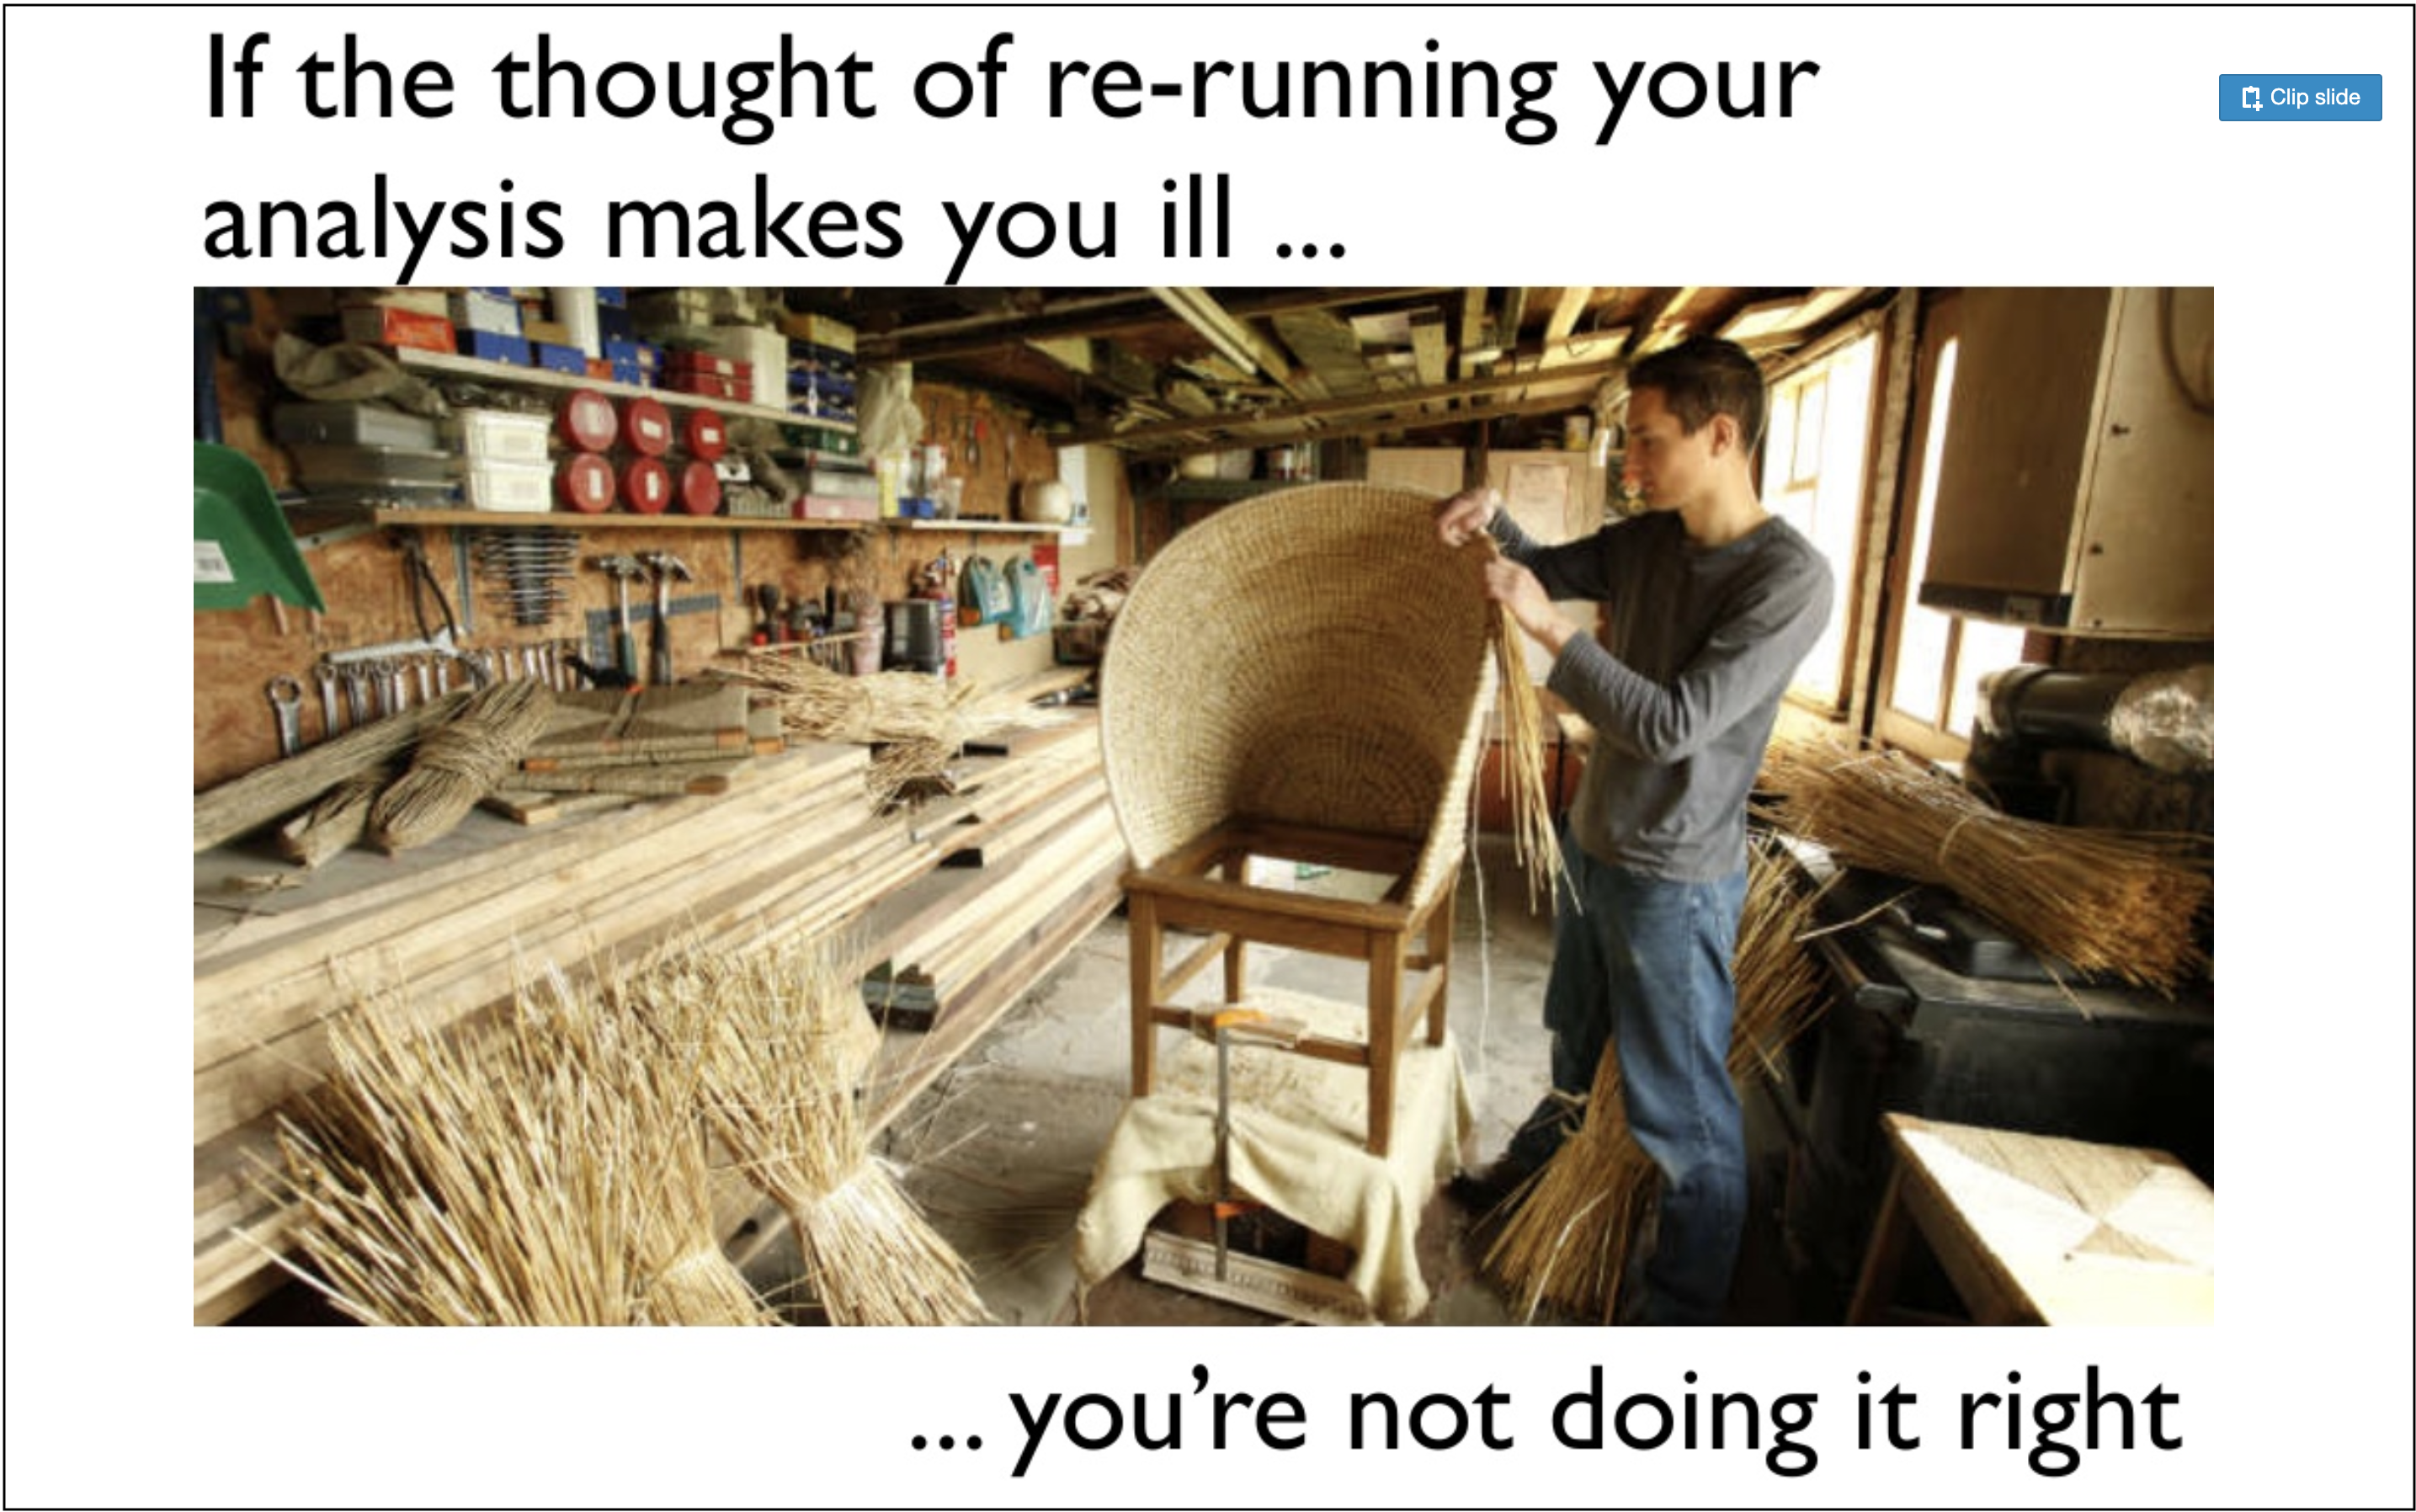
Make sure to frequently re-start R as you’re working, as elaborated on by Jenny Bryan here.
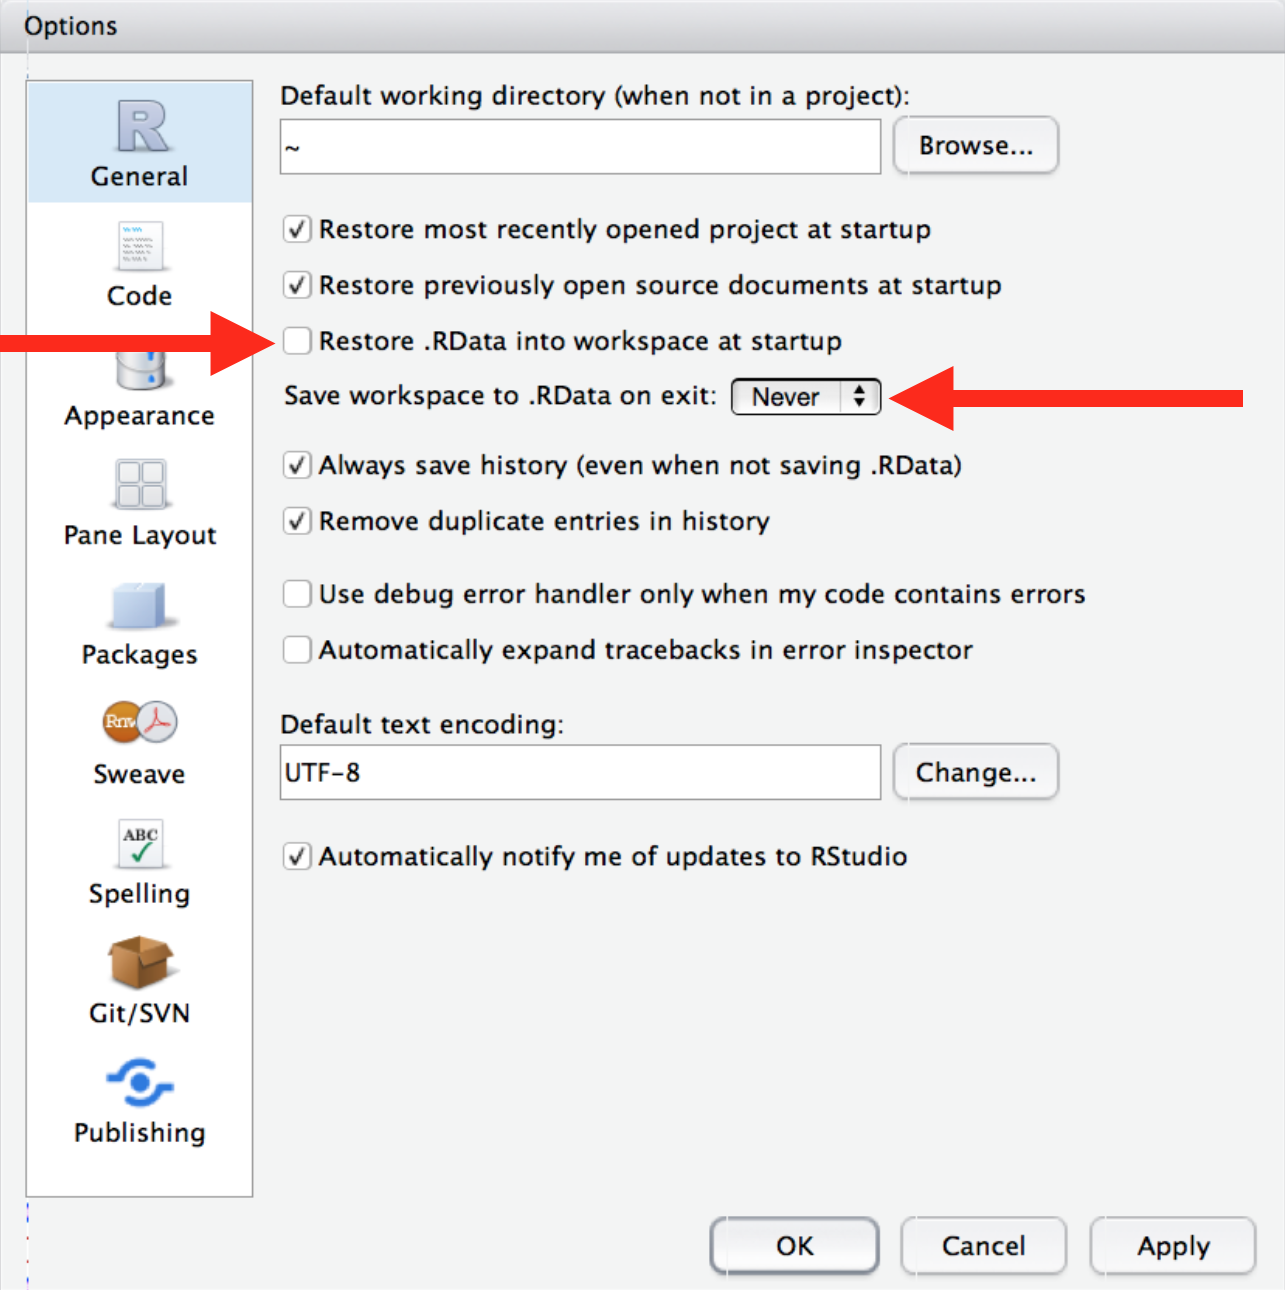
Also, if you haven’t already, follow the instructions from r4ds on how ensure that RStudio does not restore your workspace between sessions, so you start with a clean environment every time. Make sure this option is selected under your RStudio preferences:
Slides from Deep thoughts by Jenny Bryan:
3. Organizing your work into R projects within RStudio makes life easier
Organizing your work into RStudio projects avoids issues with absolute file paths and makes it easier to keep track of the code used to generate plots and reports, share your code with others, and work on multiple different projects in parallel. Not convinced yet? Check out What they forgot to teach you about R
4. Explain and document your thought process with notes and comments
Document the big-picture structure both within files (comments) and between files (README’s). In general, comments (and Git commit messages) should explain the why not the what (which should be self-evident from well-written code). Can a collaborator or you-in-six-months quickly figure out what’s going on in your code?
5. Develop a consistent coding style that maximizes readability
Developing a consistent style in your coding, makes it a lot easier to read. Here is some inspiration:
- The tidyverse style guide
- A more concise overview of the style Hadley Wickham uses in his books “R for Data Science” and “Advanced R”
- There are also great tips for styling, organizing and optimizing your code in the blogpost R Best Practices: R you writing the R way! by Milind Paradkar
- Many of the same principles are also summarized by JEFworks here
6. “Write code for humans, write data for computers”
Very important advice from Vince Buffalo
Some ways to make code more human-readable include:
- Clear workflows
- Use comments
- Give objects meaningful names
- Use functions with meaningful names
- Use well-named operations,
e.g.
select(data, column_name)instead ofdata[,5]
7. Make your data tidy
An important principle for “writing data for computers” is to clean up and reshape your data into tidy format for analysis. That way, you can take advantage of the powerful set of tools available in the tidyverse and beyond instead of having to invent your own roundabout approaches, and this will both make your code more robust, concise, and readable. As a reminder, have another look at the Openscapes tidy data blog post
Resources for learning more
R and the tidyverse
- R for Data Science by Wickham, Çetinkaya-Rundel, and Grolemund. See also answers to the exercises here or here for solutions to the first edition of R4DS, as well as a dedicated R4DS Slack workspace for community learning. [I strongly recommend working through the chapters of this book that we have not covered]
- Advanced R by Hadley Wickham
- What they forgot to teach you about R by Jenny Bryan and Jim Hester
- R for the Rest of Us - Resources page - a curated list of excellent tutorials
- Course notes for STAT545 by Jenny Bryan
- Practical Data Science for Stats - a PeerJ Collection
- ggplot2: Elegant Graphics for Data Analysis by Hadley Wickham
Here are a few other books you might want to check out:
- A ModernDive into R and the
tidyverse by Chester Ismay and Albert Y. Kim
- Introduction to Data
Science: Data Analysis and Prediction Algorithms with R by Rafael A.
Irizarry
- The R Cookbook by James Long and Paul Teetor (primarily base-R, but also uses some tidyverse packages/functions)
And for getting help, check out the slide deck or recorded talk for Jenny Bryan’s talk “Object of type ‘closure’ is not subsettable” at the 2020 RStudio conference. You can also check out her Reprex webinar.
GitHub
- Happy Git and GitHub for the useR by Jenny Bryan
- If you want to get started with command line workflows, the Software Carpentry Lesson on Git is a good place to start
Open practices in environmental data science
- Check out and follow developments at Openscapes, an awesome organization led by Julia Stewart Lowndes aimed at empowering environmental scientists to do better science in less time through open and collaborative practices.
Learn to leverage chatGPT and other AI applications
Can help write code and troubleshoot. But always important to check for accuracy. Can also help you learn R better (see e.g. here)
More cool R applications
Dashboards:
Check out the Dashboard developed for the continually updated Coronavirus dataset we worked with earlier in the course. Note that you can grab all the code in the linked GitHub repo
Dashboards can also be made interactive with dynamic and user-controlled displays of data through use of Shiny, an R package that makes it easy to build interactive web apps straight from R.
For an example, check out this dynamic visualization of the gapminder dataset we worked with in our last class (make sure to check out the cool video with Hans Rosling)
Shiny let’s you create similar interactive displays. See for example a very simple example here, and materials for building a more advanced version here
For more examples, check out the RStudio Flexdashboard website. And check out Mastering shiny by Hadley Wickham
Making cool maps
R has lots of functionality for making maps. See some examples of a beautiful application to illustrate the distribution patterns of birdpopulations through the Bird Genoscape Project
Some example code for making similar maps: https://github.com/eriqande/make-a-BGP-map?tab=readme-ov-file https://eriqande.github.io/rep-res-eeb-2017/plotting-spatial-data-with-ggplot.html https://eriqande.github.io/rep-res-eeb-2017/a-tidy-approach-to-spatial-data-simple-features.html
Here are some other useful tutorials: https://www.andrewheiss.com/blog/2023/07/28/gradient-map-fills-r-sf/index.html https://learning.nceas.ucsb.edu/2023-04-coreR/session_15.html
Here’s the cheatsheet for the very useful package sf https://github.com/rstudio/cheatsheets/blob/main/sf.pdf
Integrating R and python code
If you need to use Python for part of your analysis, check out the reticulate package that facilitates interoperability between Python and R.
Connecting with the R stats community
Tips on how to start engaging on twitter from R for Excel Users by Julia Lowndes and Allison Horst
Finding the YOU in the R community by Thomas Mock
Exercise
Go to the RStudio Tips twitter account (https://twitter.com/rstudiotips) and find one tip that looks interesting. Practice using it!
Here is an example of a very useful thread, listing RStudio shortcuts
Take-home messages
From the Ocean Health Index Data Science Training:
Three messages
If there are 3 things to communicate to others after this course, I think they would be:
1. Data science is a discipline that can improve your analyses
- There are concepts, theory, and tools for thinking about and working with data.
- Your study system is not unique when it comes to data, and accepting this will speed up your analyses.
This helps your science:
- Think deliberately about data: when you distinguish data questions from research questions, you’ll learn how and who to ask for help
- Save heartache: you don’t have to reinvent the wheel
- Save time: when you expect there’s a better way to do what you are doing, you’ll find the solution faster. Focus on the science.
2. Open data science tools exist
- Data science tools that enable open science are game-changing for analysis, collaboration and communication.
- Open science is “the concept of transparency at all stages of the research process, coupled with free and open access to data, code, and papers” (Hampton et al. 2015))
This helps your science:
- Have confidence in your analyses from this traceable, reusable record
- Save time through automation, thinking ahead of your immediate task, reduced bookkeeping, and collaboration
- Take advantage of convenient access: working openly online is like having an extended memory
3. Learn these tools with collaborators and community (redefined):
- Your most important collaborator is Future You.
- Community should also be beyond the colleagues in your field.
- Learn from, with, and for others.
This helps your science:
- If you learn to talk about your data, you’ll find solutions faster.
- Build confidence: these skills are transferable beyond your science.
- Be empathetic and inclusive and build a network of allies
Reflection questions as we wrap up the course
- What is the most valuable thing you have learned in this class?
- Are you planning to implement any changes your workflow or practices moving forward
- What are you excited about learning next or what existing skills do you want to improve?
Tips for troubleshooting
Getting help, or really helping you help yourself, means moving beyond “it’s not working” and towards solution-oriented approaches. Part of this is the mindset where you expect that someone has encountered this problem before and that most likely the problem is your typo or misuse, and not that R is broken or hates you.
There is excellent advice for trouble-shooting R-code and how to get help in Lecture 2 from ESM 206: Statistics and Data Analysis in Environmental Science and Management by Allison Horst.