Lesson 15: Functions
Readings
Announcements
- Next week is our last week - only two more classes left
- You will be giving your 1.5 minute end-of-class student presentations next Wednesday (Nov 11). Please indicate here whether you will be giving your presentation during the live Zoom call (preferred) or submit a video. The presentations are part of the requirements to pass the course. Auditors are encouraged, but not required, to present.
Today’s learning objectives
Today, we will first wrap up our coverage of for loops and then briefly introduce functions in R.
By the end of today’s class, you should be able to:
- Write a
forloop to repeat operations on different input - Implement
ifandif elsestatements for conditional execution of code - Write a simple function to automate a task
Getting back to where we were
We will continue working with the gapminder dataset, so let’s first load that back in, along with the tidyverse.
library(tidyverse)
library(gapminder) #install.packages("gapminder")

gapminder
During our last class, we had developed the following for loop that would save a separate plot total GDP over time for each country in Europe.
dir.create("figures")
dir.create("figures/Europe")

## create a list of countries. Calculations go here, not in the for loop
gap_europe <- gapminder %>%
  filter(continent == "Europe") %>%
  mutate(gdpTot = gdpPercap * pop)

country_list <- unique(gap_europe$country) # ?unique() returns the unique values

for (cntry in country_list) { # (cntry = country_list[1])

  ## filter the country to plot
  gap_to_plot <- gap_europe %>%
    filter(country == cntry)

  ## add a print message to see what's plotting
  print(paste("Plotting", cntry))

  ## plot
  my_plot <- ggplot(data = gap_to_plot, aes(x = year, y = gdpTot)) +
    geom_point() +
    ## add title and save
    labs(title = paste(cntry, "GDP per capita", sep = " "))

  ggsave(filename = paste("figures/Europe/", cntry, "_gdpTot.png", sep = ""), plot = my_plot)
}
Now, let’s add some additional functionality to this loop
Conditional statements with if and else
Often when we’re coding we want to control the flow of our actions. This can be done by setting actions to occur only if a condition or a set of conditions are met.
In R and other languages, these are called “if statements”.
if statement basic structure
# if
if (condition is true) {
  do something
}
# if ... else
if (condition is true) {
  do something
} else {  # that is, if the condition is false,
  do something different
}
Let’s bring this concept into our for loop for Europe that we’ve just created. What if we want to add the label “Estimated” to countries for which the figures were estimated rather than based on official reported statistics? Here’s what we’d do.
First, import csv file with information on whether data was estimated or reported, and join to gapminder dataset:
est <- read_csv("https://raw.githubusercontent.com/OHI-Science/data-science-training/master/data/countries_estimated.csv")
gapminder_est <- left_join(gapminder, est)
dir.create("figures")
dir.create("figures/Europe")
## create a list of countries. Calculations go here, not in the for loop
gap_europe <- gapminder_est %>% # Here we use the gapminder_est that includes information on whether data were estimated
filter(continent == "Europe") %>%
mutate(gdpTot = gdpPercap * pop)
country_list <- unique(gap_europe$country) # ?unique() returns the unique values
for (cntry in country_list) { # (cntry = country_list[1])
## filter the country to plot
gap_to_plot <- gap_europe %>%
filter(country == cntry)
## add a print message to see what's plotting
print(paste("Plotting", cntry))
## plot
my_plot <- ggplot(data = gap_to_plot, aes(x = year, y = gdpTot)) +
geom_point() +
## add title and save
labs(title = paste(cntry, "GDP per capita", sep = " "))
## if estimated, add that as a subtitle.
if (gap_to_plot$estimated == "yes") {
## add a print statement just to check
print(paste(cntry, "data are estimated"))
my_plot <- my_plot +
labs(subtitle = "Estimated data")
}
# Warning message:
# In if (gap_to_plot$estimated == "yes") { :
# the condition has length > 1 and only the first element will be used
ggsave(filename = paste("figures/Europe/", cntry, "_gdpTot.png", sep = ""),
plot = my_plot)
} This worked, but we got a warning message with the if statement. This is because if we look at gap_to_plot$estimated, it is many “yes”s or “no”s, and the if statement works just on the first one. We know that if any are yes, all are yes, but you can imagine that this could lead to problems down the line if you didn’t know that. So let’s be explicit:
Executable if statement
dir.create("figures")
dir.create("figures/Europe")

## create a list of countries. Calculations go here, not in the for loop
gap_europe <- gapminder_est %>%  # Here we use the gapminder_est that includes information on whether data were estimated
  filter(continent == "Europe") %>%
  mutate(gdpTot = gdpPercap * pop)

country_list <- unique(gap_europe$country) # ?unique() returns the unique values

for (cntry in country_list) { # (cntry = country_list[1])

  ## filter the country to plot
  gap_to_plot <- gap_europe %>%
    filter(country == cntry)

  ## add a print message to see what's plotting
  print(paste("Plotting", cntry))

  ## plot
  my_plot <- ggplot(data = gap_to_plot, aes(x = year, y = gdpTot)) +
    geom_point() +
    ## add title and save
    labs(title = paste(cntry, "GDP per capita", sep = " "))

## if estimated, add that as a subtitle.
if (any(gap_to_plot$estimated == "yes")) { # any() will return a single TRUE or FALSE

    ## add a print statement just to check
    print(paste(cntry, "data are estimated"))

    my_plot <- my_plot +
      labs(subtitle = "Estimated data")
  }

  ggsave(filename = paste("figures/Europe/", cntry, "_gdpTot.png", sep = ""),
         plot = my_plot)

}
OK so this is working as we expect! Note that we do not need an else statement above, because we only want to do something (add a subtitle) if one condition is met. But what if we want to add a different subtitle based on another condition, say where the data are reported, to be extra explicit about it?
Executable if/else statement
dir.create("figures")
dir.create("figures/Europe")

## create a list of countries. Calculations go here, not in the for loop
gap_europe <- gapminder_est %>%  # Here we use the gapminder_est that includes information on whether data were estimated
  filter(continent == "Europe") %>%
  mutate(gdpTot = gdpPercap * pop)

country_list <- unique(gap_europe$country) # ?unique() returns the unique values

for (cntry in country_list) { # (cntry = country_list[1])

  ## filter the country to plot
  gap_to_plot <- gap_europe %>%
    filter(country == cntry)

  ## add a print message to see what's plotting
  print(paste("Plotting", cntry))

  ## plot
  my_plot <- ggplot(data = gap_to_plot, aes(x = year, y = gdpTot)) +
    geom_point() +
    ## add title and save
    labs(title = paste(cntry, "GDP per capita", sep = " "))

## if estimated, add that as a subtitle.
if (any(gap_to_plot$estimated == "yes")) { # any() will return a single TRUE or FALSE

    ## add a print statement just to check
    print(paste(cntry, "data are estimated"))

    my_plot <- my_plot +
      labs(subtitle = "Estimated data")
} else {

  print(paste(cntry, "data are reported"))

  my_plot <- my_plot +
    labs(subtitle = "Reported data") }

  ggsave(filename = paste("figures/Europe/", cntry, "_gdpTot.png", sep = ""),
         plot = my_plot)

}
Note that this works because we know there are only two conditions, Estimated == yes and Estimated == no. In the first if statement we asked for estimated data, and the else condition gives us everything else (which we know is reported). We can be explicit about setting these conditions in the else clause by instead using an else if statement. Below is how you would construct this in your for loop, similar to above:
  if (any(gap_to_plot$estimated == "yes")) { # any() will return a single TRUE or FALSE

    print(paste(cntry, "data are estimated"))

    my_plot <- my_plot +
      labs(subtitle = "Estimated data")
  } else if (any(gap_to_plot$estimated == "no")){

    print(paste(cntry, "data are reported"))

    my_plot <- my_plot +
      labs(subtitle = "Reported data")

  }
This construction is necessary if you have more than two conditions to test for.
We can also add the conditional addition of the plot subtitle with R’s ifelse() function. It works like this
ifelse(condition is true, perform action, perform alternative action)where the first argument is the condition or set of conditions to be evaluated, the second argument is the action that is performed if the condition is true, and the third argument is the action to be performed if the condition is not true. We can add this directly within the initial labs() layer of our plot for a more concise expression that achives the same goal:
dir.create("figures")
dir.create("figures/Europe")

## create a list of countries. Calculations go here, not in the for loop
gap_europe <- gapminder_est %>%  # Here we use the gapminder_est that includes information on whether data were estimated
  filter(continent == "Europe") %>%
  mutate(gdpTot = gdpPercap * pop)

country_list <- unique(gap_europe$country) # ?unique() returns the unique values

for (cntry in country_list) { # (cntry = country_list[1])

  ## filter the country to plot
  gap_to_plot <- gap_europe %>%
    filter(country == cntry)

  ## add a print message to see what's plotting
  print(paste("Plotting", cntry))

  ## plot
  my_plot <- ggplot(data = gap_to_plot, aes(x = year, y = gdpTot)) +
    geom_point() +
    ## add title and save
    labs(title = paste(cntry, "GDP per capita", sep = " "), subtitle = ifelse(any(gap_to_plot$estimated == "yes"), "Estimated data", "Reported data"))

  ggsave(filename = paste("figures/Europe/", cntry, "_gdpTot.png", sep = ""),
         plot = my_plot)

}
Looping with an index and storing results
In the example we’ve been using to build a for loop together, we’ve been iterating over a list of countries (in turn assigning each of these to our cntry object). You may often see for loops iterating over a numerical index, often using i as the object that in turn gets assigned each number from a sequence. Here is an example:
for (i in 1:10) {
  print(paste("Part_", i, sep = ""))
}
As another example, last class, we needed to calculate the product of gdpPercap and population size for each year and each country. We did this efficiently in a single step for all years and countries with a `mutate(), prior to defining our loop or function.
gap_europe <- gapminder_est %>%  # Here we use the gapminder_est that includes information on whether data were estimated
  filter(continent == "Europe") %>%
  mutate(gdpTot = gdpPercap * pop)
A (not very computationally efficient) alternative would be to do this calculation for a specific country with a for loop and using square bracket indexing to select the i’th element of a vector.
gapminder$gdpTot <-  vector(length = nrow(gapminder))

for (i in 1:nrow(gapminder)) {
  gapminder$gdpTot[i] <- gapminder$gdpPercap[i] * gapminder$pop[i]
}
To understand how this loop is working exactly the same way as our previous loop, have a look of the list of elements 1:nrow(gapminder) that we loop over.
1:nrow(gapminder)You see that this just gives a vector of integers from 1 to the number of rows in the gapminder data. Each of these numbers in turn get assigned to i as we run through the loop.
Functions
Turning the operation we iterate over with our for loop into a function
Instead of running our for loop to create a plot for every country in a list of countries, we can re-write the plotting operation as a function that we can call for specific countries.
To simplify the code, let’s go back to what our loop looked like before we added the conditional statements:
dir.create("figures")
dir.create("figures/Europe")

## create a list of countries. Calculations go here, not in the for loop
gap_europe <- gapminder %>%
  filter(continent == "Europe") %>%
  mutate(gdpTot = gdpPercap * pop)

country_list <- unique(gap_europe$country) # ?unique() returns the unique values

for (cntry in country_list) { # (cntry = country_list[1])

  ## filter the country to plot
  gap_to_plot <- gap_europe %>%
    filter(country == cntry)

  ## add a print message to see what's plotting
  print(paste("Plotting", cntry))

  ## plot
  my_plot <- ggplot(data = gap_to_plot, aes(x = year, y = gdpTot)) +
    geom_point() +
    ## add title and save
    labs(title = paste(cntry, "GDP per capita", sep = " "))

  ggsave(filename = paste("figures/Europe/", cntry, "_gdpTot.png", sep = ""), plot = my_plot)
}
Now, we can change this into a function in the following way:
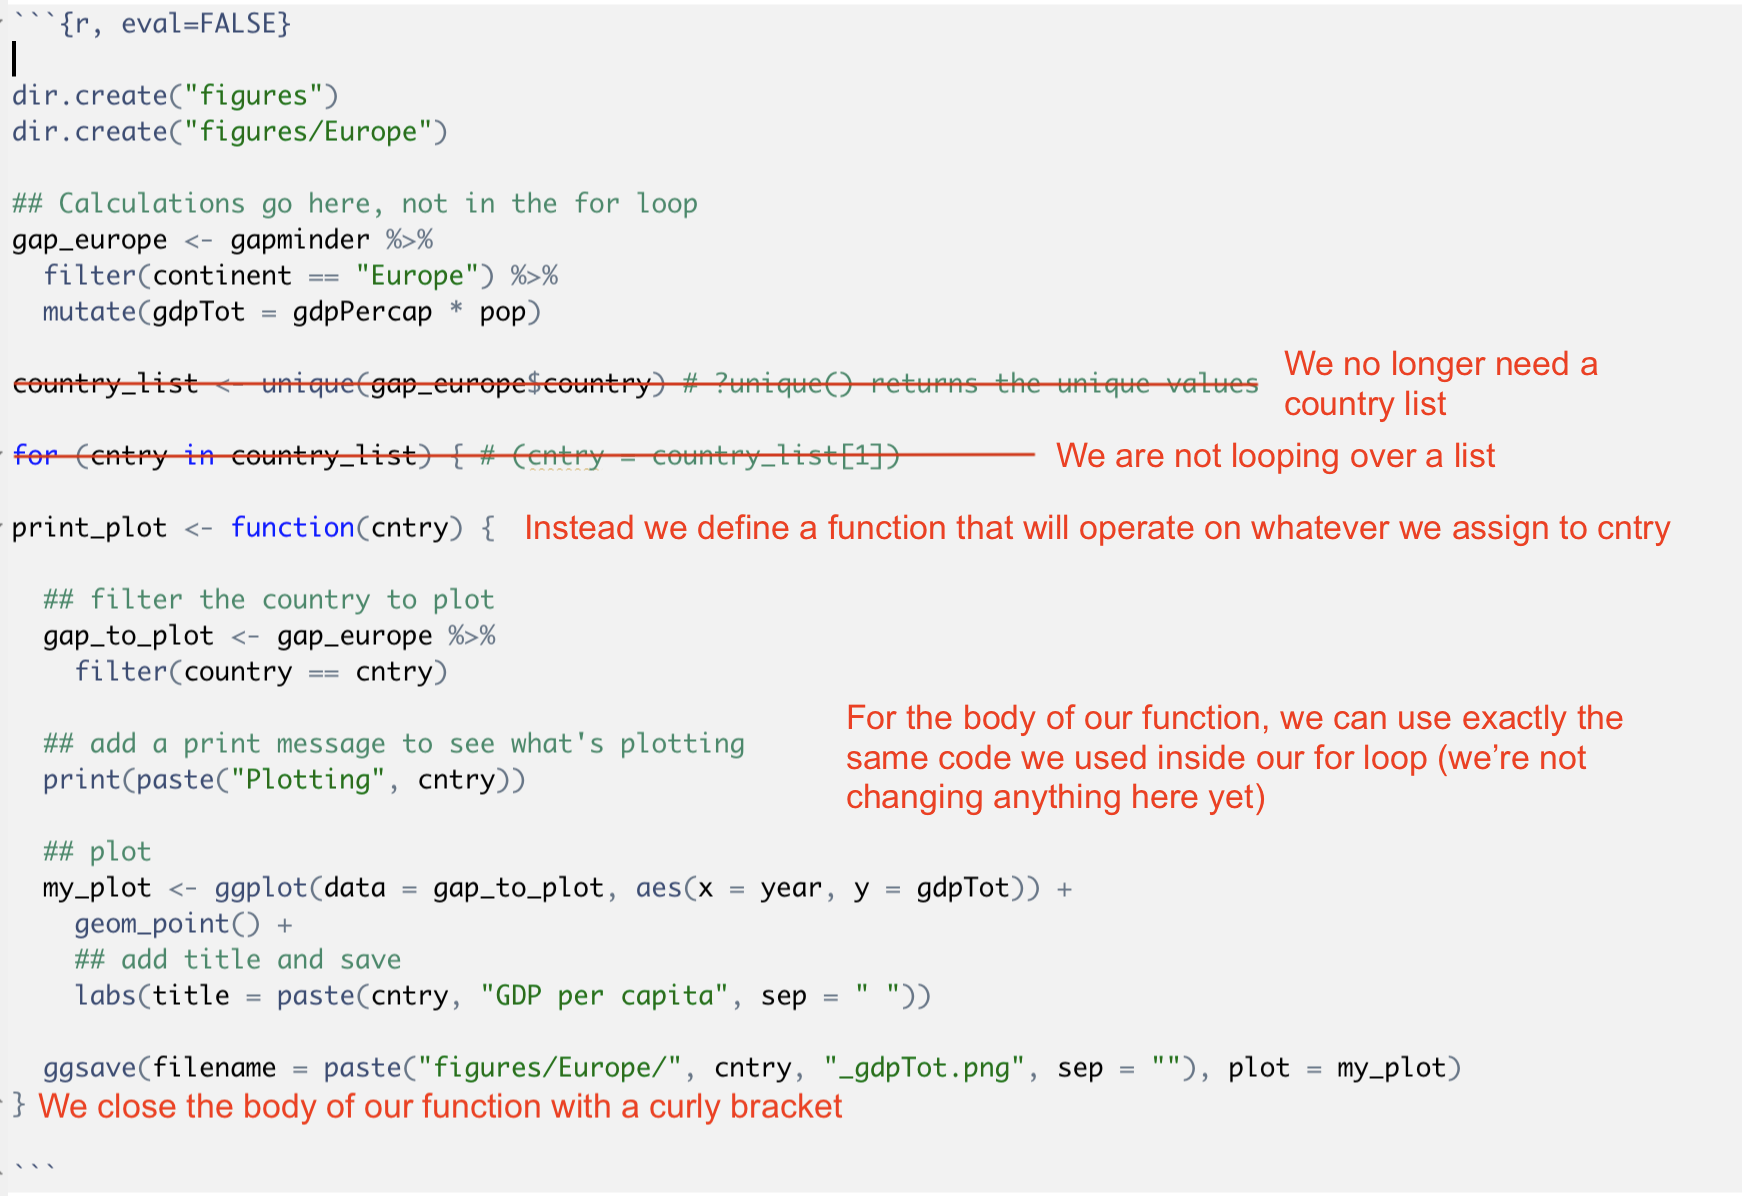
Here is our function:
dir.create("figures")
dir.create("figures/Europe")

## We still keep our calculation outside the function because we can do this as a single step for all countries outside the function. But we could also build this step into our function if we prefer.
gap_europe <- gapminder %>%
  filter(continent == "Europe") %>%
  mutate(gdpTot = gdpPercap * pop)

#define our function
save_plot <- function(cntry) {

  ## filter the country to plot
  gap_to_plot <- gap_europe %>%
    filter(country == cntry)

  ## add a print message to see what's plotting
  print(paste("Plotting", cntry))

  ## plot
  my_plot <- ggplot(data = gap_to_plot, aes(x = year, y = gdpTot)) +
    geom_point() +
    ## add title and save
    labs(title = paste(cntry, "GDP per capita", sep = " "))

  ggsave(filename = paste("figures/Europe/", cntry, "_gdpTot.png", sep = ""), plot = my_plot)
}
We can not run this function on specific countries
save_plot("Germany")
save_plot("France")

# We can even write a for loop to run the function on each country in a list of countries (doing exactly the same as our for loop did before, but now we have pulled the code specifying the operation out of the for loop itself)

country_list <- unique(gap_europe$country) # ?unique() returns the unique values

for (cntry in country_list) {

  save_plot(cntry)

}
Now we can add some more flexibility to our function. Currently, it is written to always plot the total GDP vs. year for a country. We can change the function so that it can plot other variables on the y-axis, as specified with an additional argument we provide when we call (and define) the function.
dir.create("figures")
dir.create("figures/Europe")

## We still keep our calculation outside the function because we can do this as a single step for all countries outside the function. But we could also build this step into our function if we prefer.
gap_europe <- gapminder %>%
  filter(continent == "Europe") %>%
  mutate(gdpTot = gdpPercap * pop)

#define our function
save_plot <- function(cntry, stat) {   # Here I'm adding an additional argument to the function, which we'll use to specify what statistic we want plotted

  ## filter the country to plot
  gap_to_plot <- gap_europe %>%
    filter(country == cntry)

  ## add a print message to see what's plotting
  print(paste("Plotting", cntry))

  ## plot
  my_plot <- ggplot(data = gap_to_plot, aes(x = year, y = get(stat))) +    # We need to use get() here to access the value we store as stat when we call the function
    geom_point() +
    ## add title and save
    labs(title = paste(cntry, stat, sep = " "), y = stat)

  ggsave(filename = paste("figures/Europe/", cntry, "_", stat, ".png", sep = ""), plot = my_plot)
}


# Let's try calling the function with different statistics and check the outputs

save_plot("Germany", "gdpPercap")
save_plot("Germany", "pop")
save_plot("Germany", "lifeExp")
This seems to work well. But what happens if we forget to specify the statistic we want plotted?
save_plot("Germany")We get an error message saying “argument”stat" is missing, with no default". We can build in a default the following way
#define our function
save_plot <- function(cntry, stat = "gdpPercap") {
Now, if we don’t specify the statistic we want plotted, the function will execute with this specified default option. The default gets “overwritten” if we do specify a stat when we call the function.
dir.create("figures")
dir.create("figures/Europe")

## We still keep our calculation outside the function because we can do this as a single step for all countries outside the function. But we could also build this step into our function if we prefer.
gap_europe <- gapminder %>%
  filter(continent == "Europe") %>%
  mutate(gdpTot = gdpPercap * pop)

#define our function
save_plot <- function(cntry, stat = "gdpPercap") {   # Here I'm adding an additional argument to the function, which we'll use to specify what statistic we want plotted

  ## filter the country to plot
  gap_to_plot <- gap_europe %>%
    filter(country == cntry)

  ## add a print message to see what's plotting
  print(paste("Plotting", cntry))

  ## plot
  my_plot <- ggplot(data = gap_to_plot, aes(x = year, y = get(stat))) +    # We need to use get() here to access the value we store as stat when we call the function
    geom_point() +
    ## add title and save
    labs(title = paste(cntry, stat, sep = " "), y = stat)

  ggsave(filename = paste("figures/Europe/", cntry, "_", stat, ".png", sep = ""), plot = my_plot)
}


# Let's try calling the function with and without specifying a statistic to plot and check the outputs

save_plot("Germany")
save_plot("Germany", "lifeExp")
Your turn
We’ve talked about how we can change file type that ggsave() will output just by changing the extension of the specified name we want to give the file. It works like this:
# To save a .png file
ggsave(filename = "figures/Europe/Germany_gdpPercap.png", plot = my_plot)

# To save a .jpg file
ggsave(filename = "figures/Europe/Germany_gdpPercap.jpg", plot = my_plot)

# To save a .pdf file
ggsave(filename = "figures/Europe/Germany_gdpPercap.pdf", plot = my_plot)
Your task: Add an argument to our function that specifies the file type you want for the plot and edit the function so that it will output the requested file type. You can also specify a default file type that the function will use if you don’t specify a file type when you call it.
If you have more time, you can also add an additional argument that specifies the plot type (x-y scatter, line plot etc) and adjust the function to accommodate this.
Answer
click to see our approach
dir.create("figures")
dir.create("figures/Europe")

## We still keep our calculation outside the function because we can do this as a single step for all countries outside the function. But we could also build this step into our function if we prefer.
gap_europe <- gapminder %>%
  filter(continent == "Europe") %>%
  mutate(gdpTot = gdpPercap * pop)

#define our function
save_plot <- function(cntry, stat = "gdpPercap", filetype = "pdf") {   # Here I'm adding additional arguments to the function, which we'll use to specify what statistic we want plotted and what filetype we want

  ## filter the country to plot
  gap_to_plot <- gap_europe %>%
    filter(country == cntry)

  ## add a print message to see what's plotting
  print(paste("Plotting", cntry))

  ## plot
  my_plot <- ggplot(data = gap_to_plot, aes(x = year, y = get(stat))) +    # We need to use get() here to access the value we store as stat when we call the function
    geom_point() +
    ## add title and save
    labs(title = paste(cntry, stat, sep = " "), y = stat)

  ggsave(filename = paste("figures/Europe/", cntry, "_", stat, ".", filetype, sep = ""), plot = my_plot)
}


# Testing our function
save_plot("Germany")
save_plot("Germany", "lifeExp", "jpg")